Engine performance
Read the performance panel on the Monitor tab so you can tell a machine that is coasting from one that is about to stutter in front of an audience.
Open the Monitor tab
Select Monitor in the top bar. On a tablet or phone the tab strip collapses into the menu button, and Monitor is in there. You can also jump straight to it from the command palette, which lists Monitor among its navigation entries.
The tab is headed System Monitor and holds four panels:
| Panel | What it covers |
|---|---|
| Performance (the panel that leads with a large FPS number) | Frame rate, Cook Time, Dropped Frames, GPU Memory, GPU, CPU, RAM |
| Network | The link between this browser and the show machine — see Network |
| Projectors | Power state, lamp hours and faults reported by projectors that support network control — see Projector health |
| Logs | Messages coming from the show machine — see Logs |
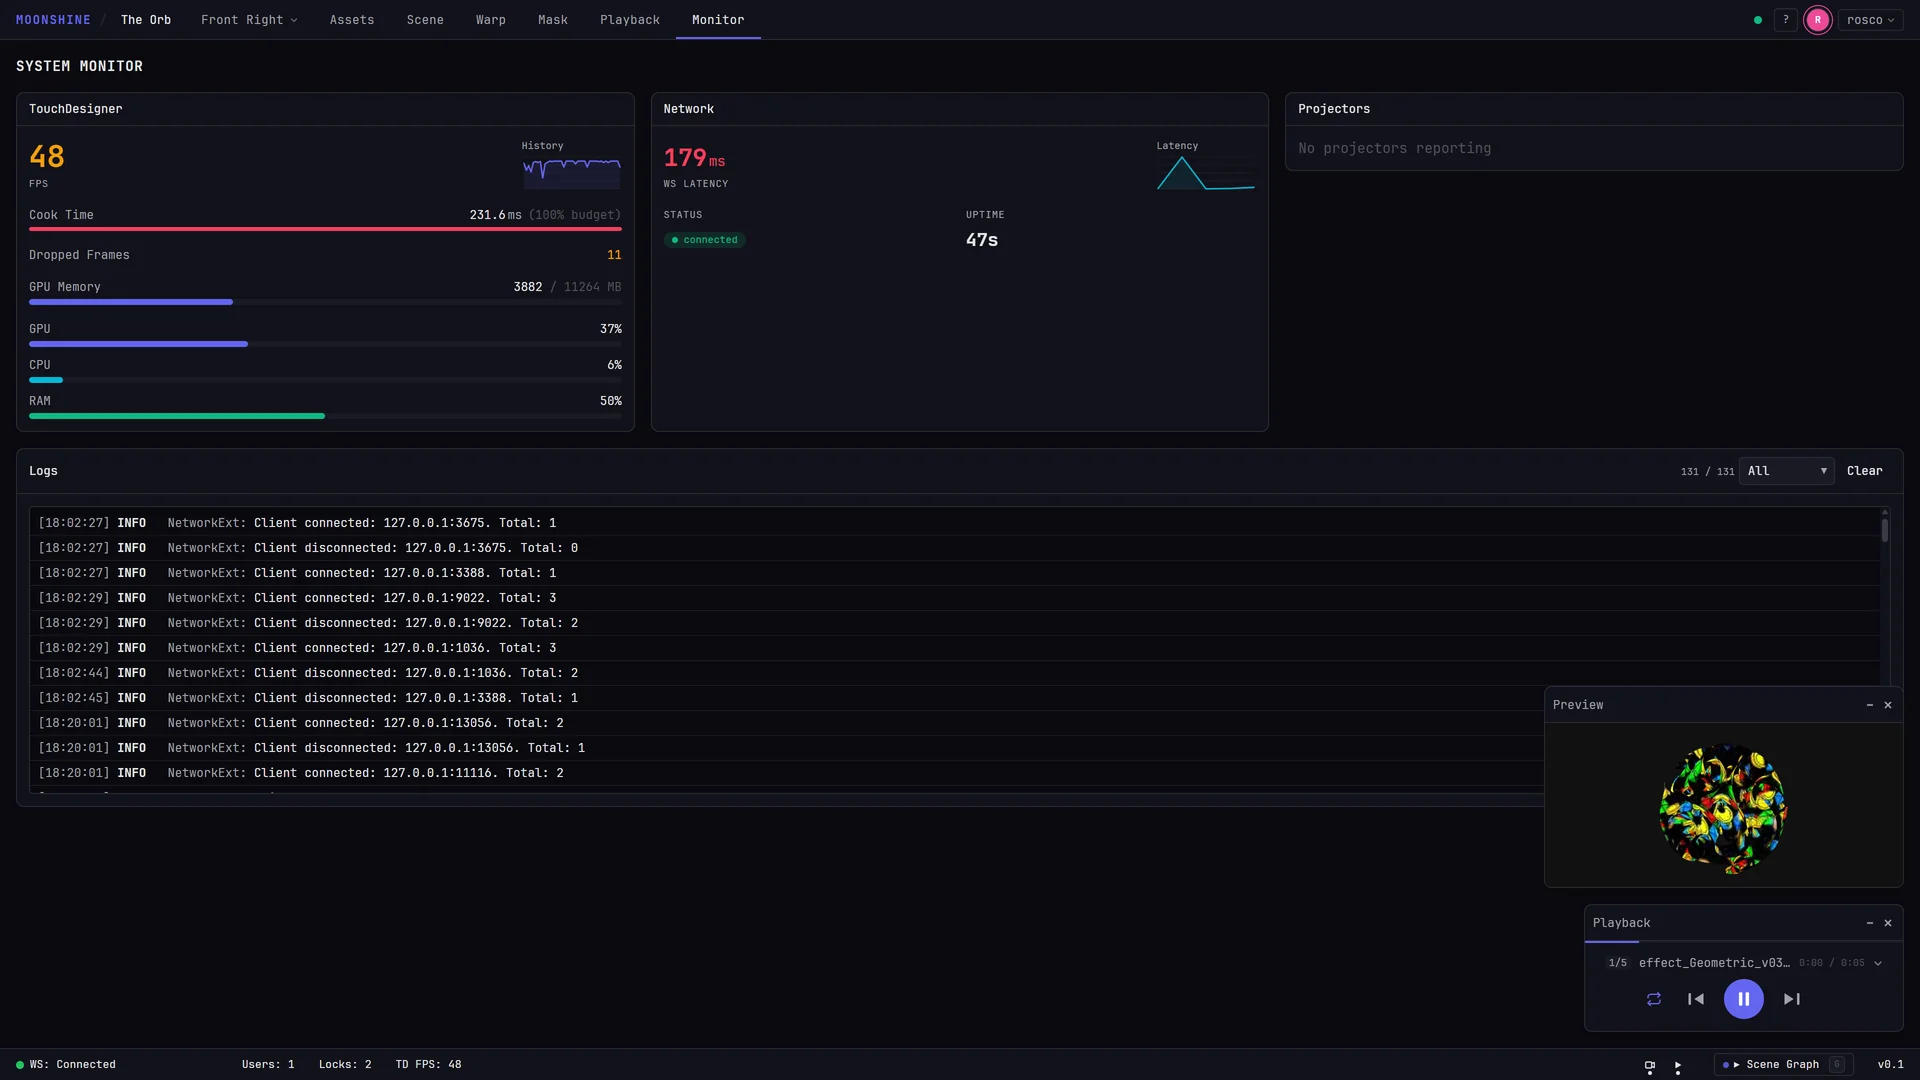
Everything on this tab is a readout — nothing here changes the show. The performance, projector and log panels are fed from the show machine, so every connected device sees the same figures and you can leave the tab open on a second device while you work on the first (see Join from another device). The Network panel is the exception: it measures the device you are looking at.
Empty panels are normal for a moment
Before the first sample arrives the panel reads Waiting for stats.... If it never fills in, this browser is not receiving data from the show machine — start with Network.
What the panel reports
| Reading | What it is |
|---|---|
| FPS | Frames per second the engine is currently producing, rounded to a whole number. |
| History | The sparkline beside the FPS number. It holds the last 60 samples, and samples arrive about once a second — so it covers roughly the last minute. |
| Cook Time | Milliseconds spent producing the last frame, followed by how much of the per-frame time budget that is — for example 8.4ms (50% budget). The bar underneath draws the same percentage. |
| Dropped Frames | A running count of frames the engine failed to deliver on time. It only goes up while the application runs, and there is no reset control in the interface. |
| GPU Memory | Graphics memory in use out of the total on the card, in MB, with a bar for the percentage. |
| GPU / CPU / RAM | Utilization percentages, each with a bar. |
GPU, GPU memory, CPU and RAM are the whole machine
Those four readings measure the show machine, not Moonshine alone. A browser, a media encoder, an antivirus scan or a file copy running on the same box all show up here. Read them as "how much room is left on this computer", not as a bill for the show. Only FPS, Cook Time and Dropped Frames are Moonshine's own numbers.
Reading the colors
The panel color-codes the readings so you can judge them at a glance instead of memorizing numbers.
| Reading | Green / normal | Amber | Red |
|---|---|---|---|
| FPS | 55 and above | 30 to 54 | below 30 |
| Cook Time bar | up to 60% of budget | 61% to 85% | above 85% |
| Dropped Frames | zero | anything above zero | — |
| GPU Memory bar | up to 70% | above 70% | above 90% |
The budget figure stops at 100%
A frame that overruns its budget still reads 100% budget — the number is clamped there. The overrun itself surfaces as a falling FPS and a rising Dropped Frames count, which is why you read the three together.
What healthy looks like
- FPS sits green and flat. A steady 60 is healthy; a steady 30 on a machine configured for 30 is also healthy. What matters is that the sparkline is a line, not a saw.
- The Cook Time bar is green and stays about the same width while you scrub, warp and play back. Headroom is the point: a show running at 55% of budget survives a heavy cue, one running at 90% does not.
- Dropped Frames is not climbing. The absolute number matters far less than the rate of change — a machine that dropped 40 frames during load-in and none since is fine.
- GPU Memory is well under the total, with room for the largest media you have not played yet.
Take a reading during rehearsal, with real content and the full rig live, and remember it. That figure — not a generic target — is your baseline for the run.
When cook time climbs
A rising Cook Time means each frame is taking longer to produce. Nothing looks wrong until the bar approaches full — then there is no headroom left, and the next demanding moment (a cue, a transition, a large file starting) arrives late.
On stage that reads as: motion content stuttering instead of gliding, a cue landing a beat after you pressed it, warp handles lagging behind the pointer.
Work through it in this order:
- Find the trigger. Watch the bar while you do one thing at a time — switch to the Warp tab, start playback, run a transition, add a projector. The action that moves the bar is the cost.
- Check each projector's resolution. In a projector's Settings, Resolution Width and Height decide how large an image the engine renders for it. A projector set far above the resolution of the device it feeds pays for pixels nobody sees. See Projectors.
- Check the media. A clip encoded far above the resolution you actually project costs time on every frame. Re-encode heavy sources closer to output resolution — see Supported file formats.
- Take unused outputs off the wall. Open the projector pane from the top bar; its sidebar lists one card per projector, each carrying an Output: On / Output: Off pill (
Output: —when no display has been assigned yet). A projector whose output is off is no longer composited to a display, so if the readings recover when you switch one off, you have found where the cost sits. See Display outputs. - Look at the same moment in the log. Open the Logs panel and check for warnings whose timestamps match the climb.
- Clear the machine. Because CPU and RAM cover the whole computer, close everything on it that is not the show.
When dropped frames appear
A dropped frame is a frame the audience never saw. One or two during load-in — while a large file is read, or a project is opened — are unremarkable. What matters is a count that keeps climbing while the show plays.
- Climbing with a green cook time. The cost is arriving in bursts rather than in the average. Find the moment it steps up (a clip starting, a transition, a device joining) and use the Logs timestamps to pin it down.
- Climbing with an amber or red cook time. The machine is simply over budget. Work the checklist above.
- Climbing while every reading looks healthy. Check the Network panel — if this browser is not receiving data smoothly, you may be looking at a stale display of an engine that is fine.
Note the count before doors
Since the counter never resets, write down the number at the start of the run. Anything above that at the end of the night is what actually happened during the show.
When GPU memory fills
The bar turns amber above 70% and red above 90%. This is the whole card, not Moonshine's share of it — but Moonshine is usually the largest consumer on a show machine, so it climbs through load-in as content and outputs are created, then flattens.
If it sits red: reduce projector resolutions, project fewer or smaller sources at once, or take media you are no longer using out of the project — see Organizing media. A machine that runs out of graphics memory mid-show does not fail gracefully.
A pre-show pass
- Open Monitor with the full rig live: every projector on, real content, real cues.
- Run the heaviest sequence in the show.
- Confirm FPS stays green and flat, the Cook Time bar keeps visible headroom, and GPU Memory is out of the amber.
- Note Dropped Frames.
- Glance at Network and Projector health, then clear the Logs so anything that appears during the show is new.
In this section
- Network — connection status, latency, and what to do when the link drops.
- Projector health — power state, lamp hours, faults, and remote control over the network.
- Logs — the live message stream and its level filter.